Guide

Blood Test Results Explained: How to Understand Blood Test Results

A step-by-step guide to understanding values, units, and reference ranges.

Educational guide only — not medical advice. Always review results with a qualified clinician.

8 min read
Last updated
Blood Test Results Explained: How to Understand Blood Test Results

Before you start: safety note

Important: This guide is educational and does not replace medical advice. If you have severe symptoms, very abnormal values, or concerns, contact a clinician.

What is a blood test report?

A blood test report (lab report) lists measurements from your blood sample. Each line usually includes: a test name, your value, the unit, and a reference range (sometimes called “normal range”).

Different labs may use different methods and ranges, so always interpret results with the lab’s own reference range.

Step 1 — Start with the context

  • Why was the test ordered? Screening, symptoms, follow-up, medication monitoring?
  • Were you fasting? Lipids and glucose-related tests may be affected.
  • Recent illness, exercise, alcohol, supplements? These can shift values.
  • Timing matters: A single result is a snapshot—trends are often more meaningful.

Step 2 — Understand the four things on each line

  1. Test name: what was measured (e.g., Hemoglobin, ALT, Ferritin).
  2. Your value: the number reported.
  3. Unit: how it’s measured (e.g., mg/dL, mmol/L, U/L).
  4. Reference range: expected range for a population under lab conditions.

Pro tip: Being slightly outside the range doesn’t automatically mean disease. It can reflect hydration, recent activity, timing, or lab variation.

Step 3 — What does “reference range” actually mean?

A reference range is often built so that most healthy people fall inside it (commonly around 95%). That means some healthy people will naturally fall slightly below or above.

Reference ranges also vary by age, sex, pregnancy status, altitude, and lab method.

Step 4 — High / Low flags: when to pay attention

Reports may show flags like H (high) or L (low). Use these flags as a signal to look closer, not a diagnosis.

  • Mild: close to the range — often re-check or consider context.
  • Moderate: clearly out of range — consider repeat plus clinical correlation.
  • Severe: far out of range — follow lab or clinician instructions promptly.

Step 5 — Learn the common panels first

Complete Blood Count (CBC)

CBC describes blood cells and oxygen-carrying capacity. Common items include:

  • WBC: white blood cells (immune response)
  • RBC / HGB / HCT: red cells and oxygen transport
  • PLT: platelets (clotting)
  • MCV / MCH / MCHC / RDW: red cell size and hemoglobin patterns

Basic metabolic / chemistry

  • Glucose: blood sugar
  • Creatinine / eGFR: kidney function indicators
  • Sodium / Potassium: electrolytes

Liver enzymes

  • ALT / AST: liver cell stress or injury markers (non-specific)
  • ALP / GGT / Bilirubin: bile flow and related pathways
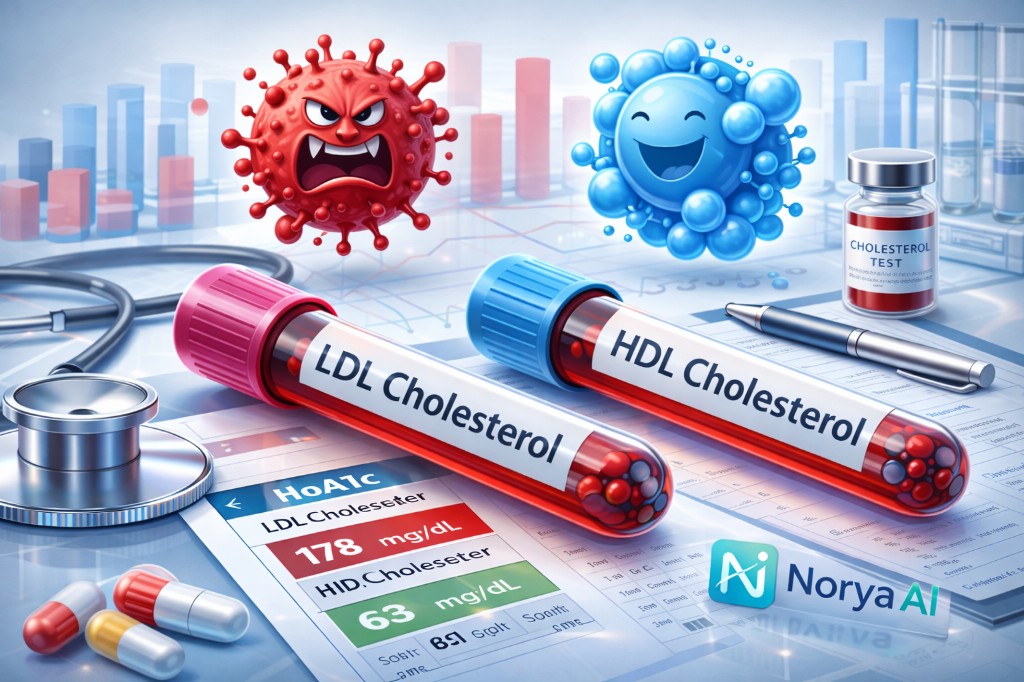
Lipids

  • Total Cholesterol, LDL, HDL, Triglycerides
  • Interpret in the context of risk factors and fasting status.

Step 6 — Units and conversions

Some results appear in different units depending on the country or lab (for example, glucose in mg/dL versus mmol/L). If you compare results between reports, confirm units match before assuming there is a change.

If you have multiple tests over time, look for:

  • Direction: improving, stable, or worsening
  • Speed: sudden shifts usually matter more
  • Consistency: repeat abnormal results are more significant than a one-off outlier

When to seek medical advice urgently

Seek urgent care if you have severe symptoms such as chest pain, fainting, shortness of breath, or confusion, or if your lab result is marked as critical and the lab or clinic advises immediate action.

Try a clearer report view

If you want a more structured overview, you can upload your lab PDF and get a clean, readable summary with key terms and reference ranges.

Analyze your blood test →

Trust & review

How this guide should be used

This article is educational and should be reviewed alongside our medical review, methodology, and transparency pages. Use it to prepare for a clinician conversation, not as a diagnosis.

Understand your blood test in minutes

Use NoryaAI to turn your results into a clear, structured health summary.

NoryaAI — turn your lab results into a structured, clinician-ready summary.

Infrastructure you can verify

Cloudflare PayTR HIPAA-oriented design

TLS in transit

Encrypted uploads and sessions

9+ languages

Same flow worldwide

PDF-native

Works with real lab exports

Blood test guides & new features

Get sample reports, lab result guides, and doctor-ready summary updates straight to your inbox.

No spam. Unsubscribe anytime.

2M+

Reports generated

9+

Languages supported

120+

Hospitals & clinics

98.7%

Biomarker classification accuracy

What our users say

NoryaAI user review photo
★★★★★

Ayşe K. · Istanbul

"I finally understood what to ask my doctor before my appointment. The report was incredibly clear."

NoryaAI user review photo
★★★★★

Markus B. · Berlin

"I discovered my Vitamin D had been critically low for years. NoryaAI flagged it immediately."

Analyze Your Blood Test Now

Upload your lab results — get your report in minutes

End-to-end encrypted
GDPR / KVKK compliant
Results in minutes

Related articles

Further reading on lab markers, trends, and sensible follow-up.

NoryaAI Back to blog Start analysis How it works Pricing

Upload your results, get a clear report

Upload your lab results securely; get plain-language explanations and key points in minutes.

Analyze blood test

Most reports are ready within minutes after upload.

Privacy-first Secure processing Built for clarity